
A skills matrix is one grid: every process the business runs down the left side, every person across the top, and a single score in each cell for how far that person can take that process alone. Built right, it answers a question the org chart cannot: if this person is out for two weeks, what stops. Most skills matrix templates go wrong in the first column, filling it with traits like communication and attention to detail. Rows are processes, and that one choice turns the grid from a personality chart into a coverage map.
What is a skills matrix?
A skills matrix is a grid that scores every person on a team against every process the business runs, so coverage and gaps are visible at a glance. You will see it called a competency matrix or a training matrix. Same artifact, same job.
Its cousin is the knowledge risk assessment, which scores the structure instead: how many holders a process has, whether anything is written down, and what stops when it stalls. The matrix scores the people standing inside it. Run both and you know where you are exposed and who can close the gap.
A skills matrix is not a scoreboard for people. It is a map of what the business can still do on a bad Tuesday.
Build the skills matrix template: processes down the side, people across the top
The build takes an afternoon, and most of that afternoon goes into the first column.
- Pull the rows from a real week. Do not brainstorm skills. Write down what the team actually did last week, process by process.
- Write every row as a verb. "Process a cancellation call" is a row. "Customer service" is a category, and categories cannot be scored.
- Put the people across the top. Everyone in the department, including yourself.
- Score every cell, including the zeros. A blank cell reads as an oversight. A zero reads as a decision nobody has made yet.
- Keep it to one screen. Twenty to forty rows per department, then split by team and give each its own tab.
Here are five rows from the office side of a residential cleaning company.
| Process | Scheduler | Ops manager | Field lead |
|---|---|---|---|
| Process a cancellation call | 3 | 2 | 0 |
| Run the skip-a-clean check | 2 | 1 | 0 |
| Build the daily dispatch | 1 | 3 | 0 |
| Run a quality walk | 0 | 1 | 3 |
| Onboard a new technician | 0 | 2 | 1 |
Five rows, three people, and the exposure is visible: the daily dispatch and the quality walk each have one person above a 1, so two of five core processes leave the building the day that person does.
The four levels that keep scoring honest
Four levels, not ten. A ten-point scale invites an argument about whether somebody is a 6 or a 7, and no decision changes based on the answer.
| Level | What it means | What proves it |
|---|---|---|
| 0 | Has never run it | Nothing yet |
| 1 | Can run it with somebody watching | One supervised run |
| 2 | Runs it alone, start to finish | An unassisted run in the last 6 months nobody had to fix |
| 3 | Has trained somebody else to a 2 | The person they trained ran it alone |
The proof gets stricter as the number rises, and level 3 is defined by somebody else's performance rather than the person's own. A 2 is the score that removes risk, and a 3 is the score that creates capacity.
Level 3 is scarcer than owners expect, because running a process well and handing it over are different abilities. One cleaning company we work with has real 3s in its field leads, who train new technicians crew by crew. Growing more of them is why building people who can teach the process deserves a program of its own.
Who scores the matrix, and why does self-scoring fail?
The person who watched the work scores it. Self-scoring fails because people score their intent and their training history rather than their last unassisted run.
One field services owner spent two full days walking a dispatcher through every step of his role. Days later the dispatcher missed a scheduled meeting because he took a break without checking his calendar. The owner's question is the whole scoring problem: how can we trust someone to do all the steps I sat with him for two days on, when he is supposed to look at his calendar fifteen times a day?
Two days of instruction is not a 2. A run nobody had to fix is a 2.
A skill somebody claims is a rumor, and a skill somebody has been watched doing is a fact.
That is the rule we apply to documentation itself: build from reality, not memory, because what people write down about their own work is always the tidy version.
When a manager scores a 1 and the person claims a 2, do not average them. Watch one run and settle it. Each disagreement marks a place where somebody was about to be handed work they cannot carry alone.
Observed scoring costs more than a survey, and that is the honest tradeoff. A manager has to watch work they would rather assume is fine, and a forty-row grid usually takes a few weeks of ordinary supervision to fill in with scores anyone would defend. A survey fills the same grid by Friday and tells you nothing you can act on.
Read the matrix: the empty row and the crowded column
Three patterns matter, and all three are visible in about ten seconds once the grid is filled in.
The nearly empty row is the first. One name above a 1 means that process has exactly one holder, and it belongs at the top of your documentation list. That is not theoretical risk. It is what breaks when your key employee calls in sick, arriving on a Monday with no notice.
Every row with one name above a 1 is a door with one key.
The crowded column is the second. When one person holds most of the 3s, you have not built a strong team, you have built a bottleneck with a good attitude. In small businesses that column usually belongs to the owner.
The third is the row where nobody scores above a 0 on work that happens every week, which means the process runs on improvisation, in as many versions as there are people.
What the matrix is for, and what it is not for
The grid earns its keep by making four decisions faster than a meeting can.
- Documentation order. Capture the thin rows first, not the loudest complaint.
- Coverage. Assign one named backup per critical process and move that person from 0 to 2.
- Interview selection. The 3s are who you record when you build training.
- Absence planning. Before anyone takes two weeks off, check which rows go thin.
Every item there is a decision about work rather than a judgment about a person, and that distinction keeps the scores honest.
Now the misuse. Never attach the matrix to pay, reviews, or rankings: the moment a level affects compensation, every score drifts upward inside one cycle, which is one of the reasons training programs stop producing capable people. It is also not an org chart. One COO asked whether we needed hers, then answered herself: she had been building around the chart, and that is not how the work is built.
Keep it current in 15 minutes a month
A skills matrix dies the way SOPs die, treated as a project instead of a rhythm. Put 15 minutes on the calendar each month, give it one owner, and run the same three moves.
- Move the levels that changed. Anyone who ran something alone this month goes up. Anyone who has not touched a process in a year comes down.
- Add the new rows. New software, new service line, new client type: each brings processes nobody has scored.
- Reread the thin rows. If a row has sat at one holder for three months, the backup plan is not a plan.
Above roughly 30 people one sheet stops working, and you want a matrix per team with a summary row rolled up, which is part of what makes training a department of 30 or more a different problem.
The grid is also where the fix starts, since cross-training without slowing the team down runs off the rows you just marked thin. When The Systems Effect maps a client's processes, the matrix falls out of the mapping work rather than a survey, because the map already shows who does what and where the handoffs land.
Open a spreadsheet this week: ten rows for the processes that would hurt most, and the three or four people who touch them. You will find your thinnest row before you finish scoring the first column.
Frequently Asked Questions
What is a skills matrix?
A skills matrix is a grid that scores every person on a team against every process the business runs. Processes go down the side, people go across the top, and each cell holds one score from 0 to 3. Its job is to make coverage and single points of failure visible at a glance.
What should the rows and columns of a skills matrix be?
Rows are processes and columns are people. Write each row as a verb, such as "run the weekly commission report," rather than an abstract skill like communication. Abstract skills cannot be proven or trained, and a grid full of them will not tell you who can cover a shift on Monday.
How do you score skill levels fairly?
Score from observation, never from a survey. Use four levels: 0 for never done it, 1 for can do it with somebody watching, 2 for runs it alone start to finish, and 3 for has trained somebody else to a 2. A 2 should require an unassisted run nobody had to fix, because training attendance and capability are not the same thing.
How often should you update a skills matrix?
Once a month, in about 15 minutes, with one named owner. Move the levels that changed, add rows for new processes, and reread any row that still has a single holder. Rebuild from scratch only when the team or the service mix changes significantly.
What is the difference between a skills matrix and a training plan?
The matrix is the diagnosis and the training plan is the prescription. The matrix names the processes with one holder and the people stuck at a 1; the plan says who gets trained on what, by whom, and by when. Building the plan first is how companies train the whole team on the process that was never at risk.
Keep reading
Stay Interviews: Ask Before They Quit
An exit interview asks someone who has already gone why they left. A stay interview asks while they are still here, and the same hour surfaces the work only they know how to do.

Train the Trainer: How to Build People Who Can Teach the Process
Most small businesses hand training to whoever is best at the job, then wonder why it does not transfer. Here is how to pick an internal trainer, equip them with a script and a rubric, and measure them on what the new hire can do alone.
How to Turn Your SOPs into a Training Program
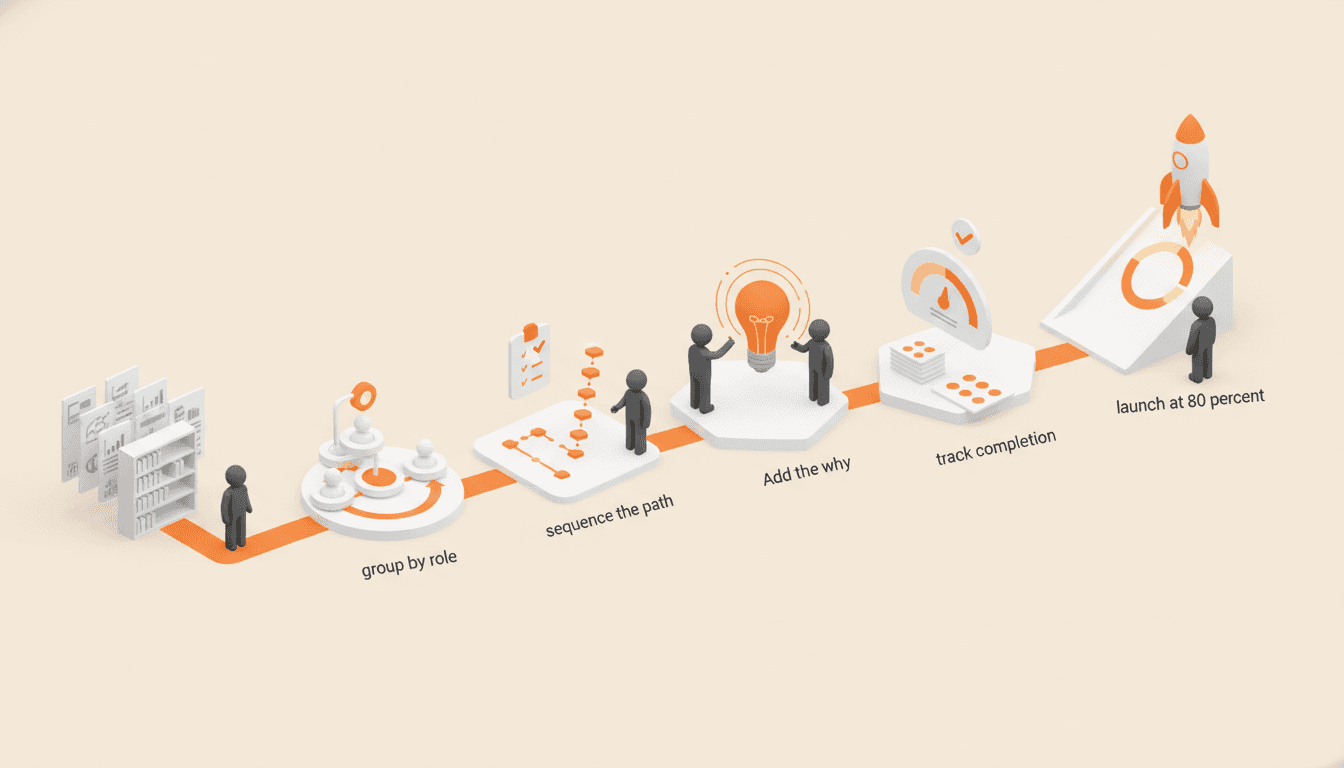
Your SOP library is not a training program yet. Here is the five step conversion: group by role, sequence the path, add the why, track completion, and launch at 80 percent.
Get one role out of one person's head in 14 days.
The interview guide, knowledge map and SOP templates we use on paid engagements. Free as Google Docs and Sheets.